To read the part 1 of this post please click here
EXAMPLE : NIFTY 50
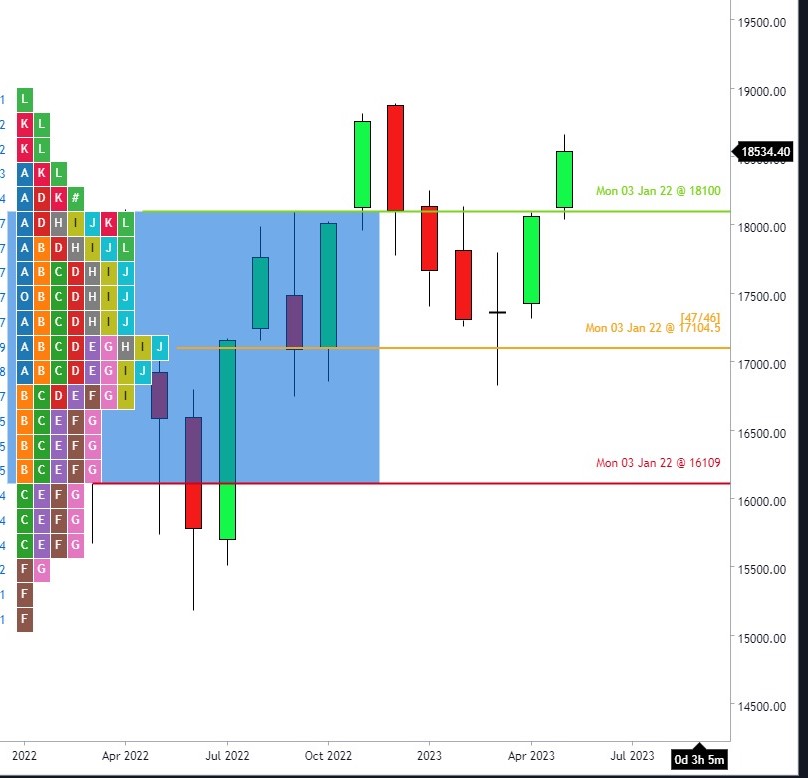
NOTE: To trade the Monthly Time Frame, we first need to switch to the ‘M’ option in our Timeframe choice. We will be using the magic of 12 concept to find the value area and Initial Balance for a year. Let us take the Nifty50 index and try to dissect this year’s move so far. By the magic of 12, we will consider each month to be a TPO. Thus, a year will have 12 TPOs( A-L ).
In the last post, we ended up initiating long trades on Nifty50 with a buy-on-dip viewpoint in the monthly time frame.

I had concluded the post in the month of March 2023 with the following notes
The usual targets are the Initial Balance High( January’s high), New swing high( 18887.60) & H3 of Camarilla 19125. Since this is a monthly chart-based trade, the targets can be hit sometime before this year ends. So, we need to enter with a farther expiry rather than an April expiry lot.
The stop loss for this trade will be the low of March 2023 at which point it can become a stop and reverse direction kind of trade if price action supports( especially if it happens in the ‘D’ or ‘E’ candle.) In that case, we can see VAL.
Now, it is September 2023 and let us see how the trade progressed.
Month: APRIL – Candle ‘D’

See how the April candle started, moved down and was defended by the buyers at the midpoint of the previous month(marked by the green dashed line). This can also be used as an entry point if we have not entered at the close of the prior month.

This is how the month of April has completed. We can still hold our long positions patiently.
Month : MAY – Candle ‘E’

In the month of May, the candle has broken out of the year’s IBH.
Notice how the initiative buyers are pushing price above the VAH of the year 18100. Value buy has now become momentum buy.

We can still hold our long positions (or roll over to the July/Aug month) as the candles are moving with momentum making higher highs and higher lows(Presence of initiative buyers). The targets mentioned earlier are also near now. Also, since there is a range extension , we can expect a target of 2xIB projected from IBL. IBL line is marked in purple. 2IB value is approximately 19250. We continue holding our longs.
Month : June – Candle ‘F’

Targets 2 & 3 – New swing high & H3 of camarilla are done. The 2xIB target is yet to be done. R1 19600 is our final target.
Month : July – Candle ‘G’

All targets are done. In the least case, if you still want to hold a few lots of your long trade, keep a fixed SL at buy price or somewhere below the E candle( breakout candle) and hold. After this the predictability becomes low so we need to have a strong plan in place.
Look at the Risk: Reward captured in this trade

The Entry point was around the close of the C candle(17360) . If we had kept the SL below the C candle( 16800) and target at R1 (19600) calculate the risk: reward.
Risk: 560 points. Let us approximate it to 600 points
Reward: 2240. Let us approximate it to 2000 points.
This is a trade that has given more than 1:3 RR
This is how we can use the magic of 12 along with market profile concepts to trade the monthly time frame.
Always remember value+ zone+ pattern= trading trifecta entry.
Note: Credit: Charts by Trading View & gocharting